Once perceived as a hack, Retrieval-Augmented Generation (RAG) has now become an essential component of LLM applications. It has been most impactful in the area of closed-domain question answering, which was considered tricky due to static knowledge bases and limited context understanding. Since RAG systems retrieve information in real-time from a continuously updated corpus (thanks to vector databases), there is no need for manual updates to a static knowledge base. By combining retrieval and generation, RAG-enabled LLM systems can better understand the context and nuances of complex queries, leading to more accurate and relevant answers. The effectiveness of RAG-enabled LLM systems has been so significant that entire ecosystems of startups and vector database providers have emerged around them.
Though RAG provides broader scope and flexibility, the challenges still remain on how to evaluate and quantify the performance of the RAG pipeline. As discussed in the previous post, eyeballing still is the primary strategy of evaluation. Though necessary, eyeballing is neither scalable nor consistent (for a human tester would like one answer one day and another on another day). As applications in production require continuous improvement, the evaluation technique should be scalable as well as consistent.
Issues that plague RAG Applications Link to heading
The challenges faced by RAG applications can be divided into two broad categories, response quality issues and wrong response generation (hallucinations).
Response quality issues arise in systems suffering from either low precision or low recall. Low precision occurs when only a few of the retrieved chunks are relevant to the query. Low recall, often accompanying low precision, happens when not all relevant chunks are retrieved, leading to incomplete or incorrect answers. When a RAG system experiences these issues, the LLM does not receive the correct chunks needed to generate a coherent and accurate answer. To summarise:
- Low precision: Not all retrieved chunks are relevant
- Low recall: Not all relevant chunks are retrieved
In addition to response quality issues, RAG systems can suffer from hallucinations, where the model generates information that is not present in the retrieved context. However, not all bad responses are due to hallucinations. Sometimes, crucial chunks needed to generate the correct answer get buried among other chunks. As a result, the LLM generates an answer based on the retrieved information, but it may be irrelevant to the question. This issue is known as the “lost in the middle” phenomenon. Thus, bad response generation can be categorised into two broad types:
- Hallucination: The answer is generated from information that is not present in the context.
- Irrelevance: The answer is generated from irrelevant information present in the context.
Evaluation Strategy Link to heading
When evaluating the RAG systems, it is crucial to employ diverse evaluation paradigms to capture the full spectrum of performance. These paradigms can be categorized into isolated evaluations of retrieval and synthesis, and end-to-end evaluations.
The answer generation process in RAG-enabled systems can be broken down to three stages:
- Input query
- Context retrieval
- Response generation
To measure the system’s overall performance, the evaluation should happen at each of these stages.
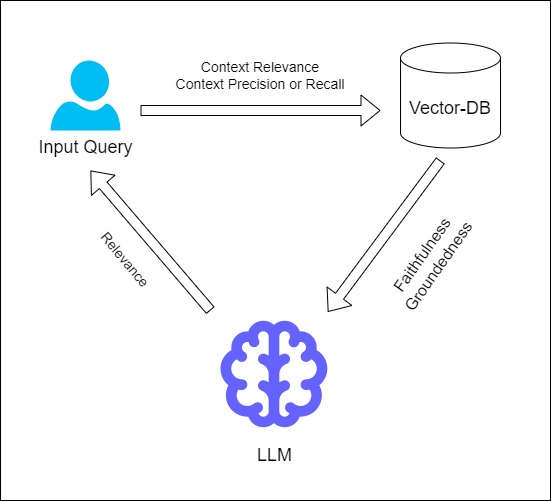
Fig 1: Stage-level evaluation
As illustrated in the above image, the effectiveness of this retrieval (with respect to input query) can be evaluated using metrics such as context relevance, context recall, and context precision. The context relevance measures how pertinent the retrieved information is to the query. The context precision measures proportion of the retrieved chunks that are relevant to answer the query, while context recall measures the proportion of relevant chunks retrieved from the total relevant chunks available in the Vector Store.
During the answer generation process, the LLM can be evaluated on two fronts.
- First, the response’s faithfulness and groundedness are assessed in relation to the retrieved context. Faithfulness ensures that the generated response accurately reflects the retrieved information, while groundedness checks if the response is firmly based on the provided context.
- Second, the answer’s relevance is measured in relation to the input query. This metric ensures that the generated response directly addresses the query, maintaining the overall relevance and coherence of the output.
By systematically evaluating these stages using specific metrics, the effectiveness of the RAG system can be comprehensively measured, making sure the responses are reliable and relevant.
Evaluation Data Link to heading
Reference-free evaluation is the simplest form of evaluation, but it offers only partial and inconsistent insights. Despite its limitations, this method can be useful for monitoring production data and assessing trends. Metrics such as faithfulness, which do not require actual references, are particularly valuable for evaluating production data.
Synthetic Dataset: The Pragmatic Approach Link to heading
A synthetic dataset presents a better alternative to reference-free evaluation, though it comes with its own set of challenges. The generated data can sometimes be biased and may not accurately represent the underlying data. Despite these issues, synthetic datasets are consistent and easy to generate.
A proper synthetic generation pipeline leverages multiple layers of generation, transformation, filtering, and auditing to create Question-Context-Answer tuples of the expected output. Continuous Eval offers a Dataset Generator, which can help in creation of such a dataset.
Synthetic dataset provides a good alternative to reference free evaluation, but it not without flaws. Primarily:
- Quality issues: LLM models, being inherently probabilistic, may be biased towards certain examples and may not generate examples with sufficient variety.
- Synthetic context generation: There is no standard way to generate synthetic RAG data. With Synthetic data, we can only evaluate answer’s correctness to the question. There’s no way to measure the performance for Retriever.
Golden Dataset: The Ideal Approach Link to heading
The golden dataset is considered the best approach for evaluation, but it requires an enormous amount of time and effort to develop. A golden dataset should have around 100 to 200 examples, that can capture the variety of scenarios that the application aims to handle.
One can undertake following steps to collect a golden dataset.
- Identify Representative Questions: Review the user logs and chat histories to compile a list of questions that users typically ask or queries that your system generates. It is better to have a forum or a feedback mechanism where user can raise a ticket or flag a wrong answer.
- Gather Ground Truth Contexts: Collecting ground truth contexts is the most challenging aspect of creating a golden dataset and should only be undertaken if absolutely necessary. The process involves determining the key pieces of information needed to provide complete answers for each question. This meticulous approach ensures that the dataset is robust and comprehensive, but it requires significant effort and resources.
- Ground Truth Answers: Using the gathered contexts, create detailed and accurate answers for each representative question. It is better to generate multiple answers for each question to cover different ways the information might be presented.
By following the above steps, you can systematically collect high-quality examples to build a comprehensive golden dataset. It is advisable to begin with synthetic data, and gradually, through manual adjustments and the collection of examples, transition into a Golden Dataset.
Evaluation Metrics Link to heading
Data Science runs on metrics. Unless we quantify our findings, we can’t differentiate the good from the bad. In case of retrievals, the quantification metrics can be divided into two broad categories:
- Rank-agnostic metrics
- Rank-aware metrics
Rank-agnostic metrics Link to heading
The rank-agnostic metrics evaluate the relevance of all retrieved chunks without considering their order. There are three well-known rank-agnostic metrics:
- Precision measures the proportion of retrieved context that is relevant, effectively evaluating the signal versus noise in the retrieval process.
- Recall assesses the completeness of the retrieval, determining what proportion of all relevant contexts are retrieved.
- F1-score is the harmonic mean of precision and recall, providing a single metric that balances both precision and recall.
Consider a document D1 divided into two chunks, C1 and C2, which are added to a Vector-DB. If a question is posed to summarise D1, and the retriever retrieves three chunks including C1 but misses C2, the precision would be 0.33, as one out of three retrieved chunks is relevant. The recall would be 0.5, since one of the two relevant chunks necessary to answer the question was retrieved.
Rank-aware metrics Link to heading
Ranking-agnostic metrics are simple but they only go so far. While precision and recall might come out to be satisfactory, LLM also reacts differently to how information is presented to them. High-ranking relevant chunks can significantly improve the quality and accuracy of the generated answers. Rank-aware metrics are essential for optimising the relevance and quality of information retrieved, which directly impacts the effectiveness of answer generation.
Mean reciprocal rank (MRR) Link to heading
MRR evaluates the effectiveness of a retrieval system by measuring how well it ranks the relevant chunks. It is defined as the average of the reciprocal ranks of the first relevant chunk retrieved for a set of queries.
$$ \text{MRR} = \frac{1}{|Q|} \sum_{i=1}^{|Q|} \frac{1}{\text{rank}_i} $$
where:
- $|Q|$ is the total number of queries.
- $\text{rank}_i$ is the rank position of the first relevant chunk for the $i$-th query.
Consider a scenario where an LLM-based system retrieves chunks in response to user queries. For three queries, the ranks of the first relevant chunks are 1, 3, and 2. The reciprocal ranks would be $1$, $\frac{1}{3}$ and $\frac{1}{2}$ respectively. Hence, the MRR would be: $$ MRR = \frac{1}{3}(1 + \frac{1}{3} + \frac{1}{2}) \approx 0.61 $$
MRR nudges models towards generating better responses by ensuring that they have access to the most important and pertinent information. This access to highly relevant data allows LLMs to produce more accurate and contextually appropriate answers to user queries.
Mean Average Precision (MAP) Link to heading
MAP provides a single-figure measure of quality across multiple queries, taking into account the precision of the retrieval system at various recall levels. It is the mean of the average precision scores for a set of queries. So, before going into MAP, we need to understand what average precision is.
Average Precision calculates the precision of the retrieval system at each position in the ranked list where a relevant chunk is found. It then averages these precision values.
$$ AP = \frac{\sum_{k=1}^{n} \left( P(k) \times \text{rel}(k) \right)}{\text{number of relevant chunks}} $$
where:
- $P(k)$ is the precision at rank $k$
- $\text{rel}(k)$ is a binary indicator function that equals $1$ if the chunk at rank $k$ is relevant, and $0$ otherwise.
So, as per the name suggests, MAP is the mean of the average precision scores for a set of queries. It provides a single metric to evaluate the performance of the retrieval system across multiple queries. Mathematically, MAP can be defines as:
$$ MAP = \frac{1}{Q} \sum_{q=1}^{Q} AP(q) $$
where:
- $Q$ is total number of queries
- $AP(q)$ is the average precision for the query $q$
A higher MAP score indicates better overall performance of the retrieval system, as it reflects both precision and the effectiveness of ranking relevant chunks higher.
Normalised Discounted Cumulative Gain (NDCG) Link to heading
NDCG measures the usefulness, or gain, of chunks based on their positions in the result list, accounting for the relevance of each chunk.It is particularly valuable because it considers the order of results and provides a normalized score that allows for comparison across different queries and systems. To understand NDCG, we need to start from cumulative gain.
Cumulative Gain (CG) is the sum of the relevance scores of all retrieved chunks for a query. Mathematically, $$ CG = \sum_{i=1}^{n} rel_i $$
where:
- $rel_i$ is the relevance score of the chunk at position $i$. A relevance score could be a binary indicator, such as:
- 0: not relevant
- 1: relevant
Discounted Cumulative Gain (DCG) improves on CG by adding a logarithmic reduction factor, which discounts the relevance of chunks as their rank positions increase. Hence, higher ranked chunk contributes more to DCG. Mathematically,
$$ DCG = \sum_{i=1}^{n} \frac{rel_i}{\log_2(i + 1)} $$
Ideal Discounted Cumulative Gain (IDCG) is the DCG score for the ideal ordering of chunks, where all relevant chunks are ranked at the top. It represents maximum possible DCG. Mathematically:
$$ IDCG = \sum_{i=1}^{|REL|} \frac{rel_i}{\log_2(i + 1)} $$
where:
- $|REL|$ is the total number of relevant documents
Normalized Discounted Cumulative Gain (NDCG) is the ratio of DCG to IDCG, providing a score between 0 and 1. This normalization allows for comparison across different queries.
$$ NDCG = \frac{DCG}{IDGC} $$
One benefit of NDCG is that it supports graded relevance, allowing documents to have varying levels of relevance rather than just being classified as relevant or not. This means documents can be rated as highly relevant, somewhat relevant, not relevant, etc., providing a more nuanced evaluation than a simple binary distinction.
Conclusion Link to heading
Despite the effectiveness of RAG, challenges in evaluating its performance persist, necessitating scalable and consistent evaluation techniques. Addressing response quality issues like low precision, low recall, and hallucinations is crucial for further improving RAG systems. Employing diverse evaluation paradigms is essential for capturing comprehensive performance insights.