Almost every Machine Learning pipeline starts from the raw data and ends at decisions. Any amount of bad data can lead to faulty decisions, which could further lead to loss of business (and in some cases, organisation’s reputation). As the data pipelines grow more and more complex, it becomes increasingly important to have a robust monitoring and observability structure in place. Neglecting this component results in monitoring debt, which is paid back in Developer’s time.
Monitoring Debt Link to heading
Analogous to technical debt, monitoring debt represents the gap between the monitoring ideals and monitoring reality. Much like technical debt, where we factor how the cost of redesigning and refactoring tomorrow allows us to ship the code today, in monitoring debt, a team gives up the ability to catch issues ahead well ahead of the stakeholders to release fast. But not enough time is not the only issue that the code becomes indebted, it could also be due to incompetence.
Like its financial counterpart, monitoring debt can be a good thing. But repaying monitoring debt (or technical debt of any kind) is difficult. And, it usually boils down to two scenarios:
- Will the same developers be around to pay the debt?
- If they are not, does the new developer have the required documentation to acquire the intimate knowledge of the working of the codebase? And, this documentation must include:
- What behaviour is normal?
- What are high-priority events one should monitor for?
It is best to have yes as an answer to the first scenario, because if the old developers didn’t have time to put proper monitoring and logging in place, you can’t expect much from documentation either.
If one doesn’t want to end up in these scenarios, it is best to embrace the three truths about monitoring.
- Monitoring is high-skilled activity - As stated above, to enable monitoring in a system requires one to have clear knowledge of monitoring goals and monitoring mechanism. The former requires “in-depth knowledge of the functioning of the system” to be monitored, while the latter requires knowledge of “how to instrument the system”.
- Monitoring is best done fresh - Retrofitting logging statements into your code doesn’t work well as it could lead to compatibility issues. These compatibility issues might demand code changes as well. Hence, the longer a system goes without monitoring, the harder it becomes to introduce monitoring.
- ML monitoring doesn’t equal traditional monitoring - Traditional monitoring techniques don’t work in Machine Learning pipelines interacting with data, which is not under your control.
Embracing the Monitoring Link to heading
Monitoring a machine learning pipeline often boils down to tying together the disparate elements of quality analysis. These quality analyses shouldn’t just stop at data. A holistic monitoring system should run quality checks on data, but shouldn’t just limit itself to it. It should also monitor the health of pipelines and drift the model is experiencing. Hence, a monitoring pipeline should have three components:
- Data Quality Monitoring
- Pipeline Health Monitoring
- Model Drift Monitoring
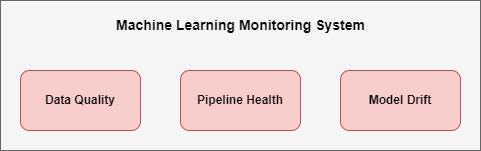
A Holistic ML Monitoring Pipeline
Data Quality Monitoring Link to heading
The term “data quality” is context dependent. Whether a data is a quality dataset depends upon the purpose it is being served for. Data that captures firmographic details of all customers might be good for Dashboards, but might not be good for training a model. Similarly, a dataset capturing embeddings might be of no use to Business Analysts working on PowerBI, despite being a goldmine for Data Scientist. So, in this situation, it is really weird to stamp some arbitrary percentage number onto the data, communicating how much “quality” it carries. For instance, a 97% quality score for data means nothing if it is not serving the purpose it intends to.
Rather than talking about something abstract like scores and percentages, it is better to talk about objectives. These objectives are the key things that we want to measure when monitoring data health, and they could be use-case dependent. These objectives could define what is “good-enough” data for us. An example of objectives could be as follow (here, I am mapping the objective I want to achieve with the GreatExpectation’s expectation):
| Objective | Identifier | Threshold |
|---|---|---|
CustomerID should be unique | expect_column_values_to_be_unique | NA |
Column MobileOS should be one of Android or iOS | expect_column_values_to_be_in_set | NA |
Column Age should have values between 18 and 100 | expect_column_values_to_be_between | 0.99 |
As evident from the table, a quality data for me would be the one where CustomerID is unique and MobileOS just contains two mentioned values. For the Age column, I am expecting the values to be between 18 and 100, but I will accept the 1% values that don’t satisfy this assumption. To elaborate:
- Objective is the quality metric we are tracking
- Identifier is how we measure this metric. Here, we are using
GreatExpectationas our identifier mechanism. - Threshold is the wiggle room we are comfortable with giving away.
Jotting down our Objectives/Identifiers provide us with significant benefits:
- The objectives/identifiers defined above can be easily translated into JSON or YAML and fed into the monitoring logic. Thus, decoupling the execution engine and test we want to perform.
- Though the tests can be performed at the same time, different teams can derive the definition of “good-enough” for their use-case by cherry-picking the results of the objectives that are of interest to them. For instance, if someone is only interested in
CustomerIDandAge, they can ignore the result of the second objective, as it is of no use to them.
Once the Data Quality Monitoring system is in place, one can identify issues such as anomalies, nulls, and duplicates, which can negatively affect the accuracy of the models they power. Catching these issues beforehand helps in preventing the flow of low-quality data, ultimately leading to better high-quality decision making.
Pipeline Health Monitoring Link to heading
The health of the data pipeline is very important for ensuring the dataflow. The pipeline health monitoring is usually the responsibility of Data Platform teams. The two very important aspects of the pipeline health are:
- Data Freshness: when were the resultant tables updated?
- Volume: how many rows were processed?
- Duration: how much time the job was in running state?
One could implement Pipeline Health Monitoring as a separate system from the Data Quality Monitoring as the owner of the former is the Data Engineering team and owner of the latter is the Data Science team. But with the rise of tools such as GreatExpectation, PySpark, Airflow, etc, the boundaries between the roles have blurred a bit.
Implementing both, Pipeline Health and Data Quality as one makes much more sense as the metrics they track are intertwined. For instance, we had a pipeline which queried and transformed 1 year worth of data. But, we noticed the volume of the pipeline increased significantly. But we didn’t have data quality monitoring till then. So, investigating data further we found a significant number of duplicate rows. If we had enabled data quality and pipeline health monitoring working in tandem, we could have localised the issue much quicker than it actually did.
Model Drift monitoring Link to heading
As almost every business is being driven by the machine learning algorithms, it becomes important to monitor the instability in the model itself. A model becomes unstable when it stays stagnant while the relationship between the target variable and independent variables evolves. An obvious solution is to retrain the model on regular intervals. The interval period can be calculated from previous experiences. But this approach has three downsides:
- It can be expensive to retrain a model and doing so without statistical backing might prove costly.
- A sudden concept drift in-between the training schedule can lead to wrong predictions. This can further lead to distrust in the modelling approach itself.
- Waiting for the problem to occur is never the best solution.
A better approach in this case is to monitor the performance of the model. An obvious approach would be to track the business metrics, or more conventional metrics like accuracy over a period of time. The issue with this approach is that one has to wait for the ground truth to actually perform this analysis (and, in some cases, we might never ground truth at all). But, this is the most robust approach.
Another approach, which is more practical, is to continually measure Data and Concept Drift. Data Drift occurs when the distribution of the input data changes, making our trained model irrelevant for the new data. For instance, a business that has extended to a new geographical region, might see an influx of customers with different spending habits, leading to significant change in underlying distribution of the data. In this case, the performance of the model will degrade, as it hasn’t “learned” these new patterns. Concept Drift occurs when the underlying distribution of the input features stays the same, but the relationship between the input data and target that the model learned no longer holds. In other words, what we are trying to predict has evolved, making the model obsolete. Concept drift is usually of two types:
- Incremental Drift: when the prediction quality decreases gradually, because of external factors such as competitors entering the market or due to macroeconomic events.
- Sudden Drift: when the relationship between the input features and target changes abruptly due to events such as lockdown due to pandemic or a stock market crash.
Having a model monitoring pipeline helps us in catching the drift in time. Once the drift is captured, one can proceed with either retraining the model (if it is justified) or updating the scope of the model to fit the current business situation. Tools like Evidently and DeepChecks can be useful for such diagnosis.
Implementation Link to heading
Though there is no hard-and-fast rule when it comes to how to implement monitoring, following the following three-step process might be a good starting point:
- Identify application and artefacts: a very obvious starting step is to identify the applications and artefacts one wants to monitor. These could be machine learning models, executive dashboards etc.
- Identify constituent components: in this step, we identify the quantifiable metrics on which we want to assess data and other artefacts, for instance, data freshness, out-of-range values etc. Teams should agree upon Objectives/3.Identifiers (performance attributes and their target sets) along with what are acceptable thresholds.
- Process if assumptions fail: in the last step, Teams should have a strategy or process in place when the quality of data or model is below the expectation. For instance, if a data quality check fails, all the downstream jobs that use this data should halt.
Conclusion Link to heading
Having a monitoring system in place in a Machine Learning Pipeline is essential to guarantee quality and availability for the assets that power this pipeline. It not only maintains certain standards, but also provides clear expectations and accountability. “Robustness” is just the by-product of this process.